
When it comes to claim denials, what’s a good number to aim for? Is 5% realistic? Is 10% something to worry about? And how does your hospital compare to others?
These are good questions, especially for rural hospitals where every dollar matters and revenue cycle teams often juggle more responsibilities than hours in the day.
The tricky part is that a denial rate doesn’t always tell the whole story. Two hospitals could have the same rate but face very different challenges depending on which claims are denied, how much revenue is at stake, and what’s causing the denials in the first place.
So, let’s put some numbers to it! We’ll walk through what our team at REDi Health considers a healthy denial rate, how to calculate yours, and what to look at when the numbers suggest there’s room for improvement.
Breaking Down Hospital Denial Rate Benchmarks
For most rural hospitals, an initial denial rate between 5% and 8% is a reasonable operating target. A rate below 5% is particularly strong, while anything above 8% is worth a closer look.
Of course, we know it’s not always that simple. Rural hospitals operate with different payor mixes, patient populations, and resources, so a number that looks concerning at one hospital might have a very different explanation at another.
To put these numbers in perspective, our team at REDi Health created a guide to interpreting initial denial rates.
Initial denial rate | What it means |
Below 5% | Strong performance/stretch goal |
5–8% | Reasonable operating target |
8–10% | Opportunity for improvement |
10–12% | Common in the industry, but higher than ideal; worth investigating |
Above 12% | Elevated; investigate by payor and reason |
These aren’t universal industry standards, but they offer a helpful starting point for understanding where your hospital stands.
If your hospital’s rate is above that 8% target, don’t get discouraged! It doesn’t necessarily mean your revenue cycle team is doing something wrong. In fact, identifying where denials occur is often the first step toward meaningful improvements.
We also encourage hospitals with lower denial rates to keep digging into their data. A hospital could have an impressive 4% denial rate but still have a handful of high-dollar claims getting denied repeatedly. Those claims may represent a bigger financial opportunity than the overall percentage suggests.
The goal isn’t simply to reach a certain number. It’s to understand what’s behind that number so your team can make informed decisions about where to focus its efforts.
How Do You Calculate Your Hospital's Initial Denial Rate?
Before comparing your hospital’s denial rate to a benchmark, make sure you’re measuring the same thing.
Your initial denial rate is the percentage of claims a payor denies when they’re first processed, before your team has a chance to correct or appeal them. It’s a helpful way to see how often claims are running into problems before payment.
Thankfully, the math is pretty simple! Divide the number of initially denied claims by the total number of claims initially adjudicated, then multiply by 100 to get your percentage.
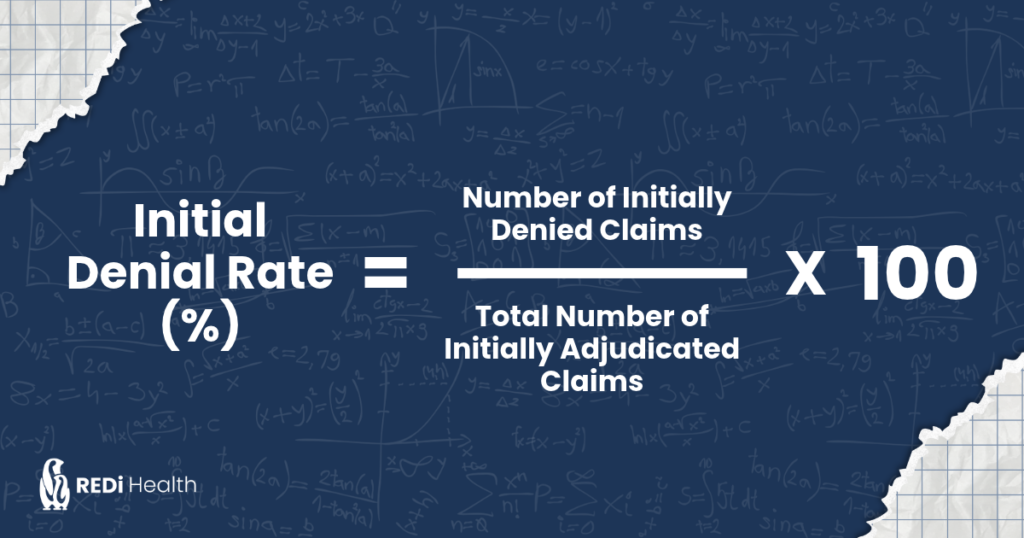
For example, let’s say your hospital had 5,000 claims initially processed by payors last month, and 400 were denied.
(400 ÷ 5,000) × 100 = 8% initial denial rate
That puts your hospital right at the upper end of the operating target we discussed earlier.
What’s the Difference Between an Initial Denial and a Final Denial?
An initial denial doesn’t necessarily mean your hospital won’t get paid. Your team might correct the issue, submit an appeal, and eventually collect the money. A final denial, on the other hand, is a claim that remains denied after the hospital has exhausted its available options to get paid.
While it’s good news when your team successfully overturns a denial, it still costs time to get that payment across the finish line. Someone has to investigate what happened, gather the necessary information, and work through the payor’s requirements. For rural hospitals with already busy revenue cycle teams, that time adds up.
That’s why we encourage hospitals to focus on initial denials rather than only what ultimately goes unpaid. If your team keeps having to fix the same problems to get claims paid, it is better to prevent them in the first place.
Why Is Denial Rate Benchmarking Different for Rural Hospitals?
It’s helpful to know how your hospital’s denial rate compares to others, but we wouldn’t recommend judging your revenue cycle performance on that number alone.
Rural hospitals have some unique circumstances that can make comparisons tricky. A small critical access hospital serving a largely Medicare population operates very differently from a larger hospital with a higher volume of commercially insured patients. Even two hospitals of similar size can have different denial experiences.
That doesn’t mean benchmarks aren’t valuable. It just means you need to consider a little more before deciding whether your hospital’s rate is where it should be.
Your Payor Mix Can Make a Difference
Not all payors have the same rules, and rural hospital revenue cycle teams know this all too well!
Medicare, Medicaid, Medicare Advantage, and commercial insurance plans each have their own requirements for things like prior authorizations, medical necessity, and claim submission. Some payors may also deny certain services or require additional documentation before approving payment.
If a large portion of your hospital’s claims comes from a payor with particularly challenging requirements, that can influence your overall denial rate.
This is why looking at denials by payor can be so revealing. You might find your hospital’s overall rate is 9%, but most denials come from just one or two payors. That’s a much more useful finding than simply knowing you’re above the 8% target.
Smaller Claim Volumes Can Have a Bigger Impact
At a hospital processing thousands of claims each week, a handful of additional denials might barely move the needle. At a smaller rural hospital, those same denials can have a much more noticeable effect on the monthly rate.
For example, if your hospital processes 500 claims in a month, just 10 additional denials would increase your rate by two percentage points.
That can make month-to-month comparisons a little misleading, especially for hospitals with lower claim volumes. Certain services and claim types can also fluctuate seasonally, which is why we typically recommend looking at year-over-year trends. Comparing the same periods across different years can give you a clearer picture of whether your denial rate is actually improving or if you’re simply seeing the usual seasonal changes.
A Low Denial Rate Doesn't Always Mean Less Revenue at Risk
Not all denied claims carry the same financial impact, and that distinction matters when evaluating your hospital’s performance.
Imagine two rural hospitals that each process 5,000 claims in a month and have identical 6% denial rates. Both have 300 denied claims, but the financial picture looks quite different.
At the first hospital, most denials involve lower-dollar claims. Staff are spending valuable time correcting and resubmitting them, but the total revenue at stake is relatively small. For this hospital, reducing repetitive administrative work could make the biggest difference.
At the second hospital, many of those 300 denials involve higher-dollar outpatient procedures. Now, the hospital could have hundreds of thousands of dollars tied up in delayed or potentially lost payments. If those claims require lengthy appeals, the hospital may also face cash flow challenges while waiting for reimbursement.
Both hospitals are meeting a reasonable denial rate target, but their priorities look quite different. One could benefit most from simplifying workflows and reducing rework, while the other may need to investigate why its higher-dollar services are being denied.
That’s why we encourage hospitals to look at denied dollars alongside their denial rates. A percentage can tell you how often claims are denied, but dollar amounts show where those denials have the greatest financial impact.
Ultimately, a useful benchmark should do more than tell you how your hospital compares to others. It should help you understand your own revenue cycle well enough to decide what deserves your attention.
What Are the Most Common Reasons Rural Hospital Claims Get Denied?
If your hospital’s denial rate is higher than you’d like, the next question is probably the most important one: What’s causing it?
A payor can deny a claim for many reasons, and your revenue cycle team has likely encountered most of them. Here are five common denial categories worth keeping an eye on:
- Eligibility and Coverage Issues: These occur when a patient’s insurance information is incorrect, their coverage has changed, or they weren’t eligible for benefits on the date of service.
- Prior Authorization and Referral Requirements: Missing authorizations, incorrect approvals, or payor-specific referral requirements can lead to denials. Keeping up with different payor rules can be especially challenging for smaller teams.
- Medical Necessity and Documentation: A payor may deny a claim because the service doesn’t meet its coverage criteria or the documentation doesn’t adequately support it. Sometimes the issue is simply a missing diagnosis or incomplete medical record.
- Coding and Billing Errors: Incorrect modifiers, outdated codes, or mismatches between diagnosis and procedure codes can prevent claims from being paid. Recurring errors may point to a larger workflow issue worth investigating.
- Timely Filing Issues: Claims submitted after a payor’s deadline may be denied, sometimes because of delays in obtaining documentation, resolving insurance questions, or correcting claim information.
Of course, knowing why a payor denied a claim is only half the battle. The more useful question is what caused the issue in the first place.
You might notice a pattern of prior authorization denials in your data, only to discover the procedures changed after the original authorizations were approved. That’s a very different issue from staff forgetting to request authorization altogether.
Understanding that difference is what helps hospitals move from repeatedly correcting denials to preventing them.
Related: Where Do Your Denials Really Begin? Introducing Topographic Denial Analysis
What Should Your Hospital Do If Its Denial Rate Is Above 8%?
First, don’t panic! An initial denial rate above 8% doesn’t mean your hospital’s revenue cycle is in trouble, but it does give you a good reason to take a closer look.
And while it might be tempting to tackle every denial category at once, we encourage hospitals to start small. You can learn a lot by taking a closer look at one problem, especially when your team is already balancing a dozen other priorities.
Find Out Where Your Denials Are Coming From
Before making changes, spend some time understanding what’s happening. Look at your denial trends over the past several months and see whether certain payors, departments, or denial reasons stand out.
For instance, your hospital might have an overall denial rate of 11%, but a closer look reveals that one payor accounts for a large share of those denials. Or outpatient imaging may have a much higher denial rate than other departments.
This is a big part of what we help rural hospitals do through our Denials IQ work. We dig into their claims data to establish a reliable baseline and uncover patterns that might otherwise be difficult to spot. Sometimes the findings confirm what hospital leaders have suspected for months. Other times, the data points to opportunities nobody realized were there.
We also look at the dollars associated with those denials. The category with the most denied claims isn’t always the one with the greatest financial impact, and knowing the difference can help hospitals decide where to focus their limited time and resources.
Get the Right People Involved
Finding a pattern in the data is exciting, but figuring out what’s causing it is where the real work begins.
Let’s say your hospital is seeing repeated eligibility denials. Your registration team might know patients often arrive with outdated insurance cards, while your billing team has noticed certain coverage changes aren’t caught until after claims are submitted.
Bringing those perspectives together can uncover what a denial report alone wouldn’t show.
It’s also why collaboration is such an important part of our Denials Navigator work. We sit down with the people who know the hospital’s workflows best, work through what’s happening, and help with change management.
We’ve always believed data should help people do their jobs, not point fingers. Hospital staff often have valuable insight into why problems keep happening, and we want them to help find solutions that work in their day-to-day routines.
Focus on One Opportunity and Measure What Happens
Once you’ve identified a recurring issue and understand what’s causing it, choose a change your team can realistically put into practice.
That might mean adjusting when you verify insurance eligibility, improving communication between scheduling and authorization staff, or creating training on documentation requirements for a frequently denied service.
Whatever the change, you’ll want to know whether it’s working.
Are fewer claims being denied for that reason? Is your team spending less time on rework? Are you seeing more revenue come through without needing an appeal?
Through Denials Navigator, we continue monitoring the data alongside hospital teams to see whether the changes are producing the results we expected. If something isn’t improving, we can revisit the process together and figure out what might be missing.
Once an improvement is working well, we can build on that progress by addressing another denial driver.
For rural hospitals, improving denial rates doesn’t have to mean overhauling the entire revenue cycle. Sometimes the most valuable progress comes from identifying one recurring problem, getting the right people around the table, and finding a better way to handle it.
A Good Denial Rate Is a Starting Point, Not the Finish Line
It’s encouraging to have a number you can measure your hospital against finally. It gives your team a sense of where things stand and something to work toward.
But we hope the biggest takeaway from this article isn’t simply that 5% to 8% is a reasonable target. It’s that your hospital’s denial rate can open the door to some really valuable conversations about what’s happening in your revenue cycle.
We’ve worked alongside rural hospital teams who knew certain claims were causing headaches but hadn’t had the time or resources to investigate why. Once we started digging into the data together, we could connect recurring denials to the underlying processes and identify opportunities for improvement.
And that’s the work we get excited about at REDi Health. Not just helping hospitals understand their numbers, but helping their teams use that information well. When a hospital can prevent a denial instead of spending time appealing it, that’s less work for an already busy staff and a better chance of getting paid without unnecessary delays.
Whether your hospital’s denial rate is 4%, 8%, or 14%, the data always has something worth learning. And you don’t have to figure it all out on your own.
Curious what your hospital’s denial data might reveal? We’d love to take a look with you.