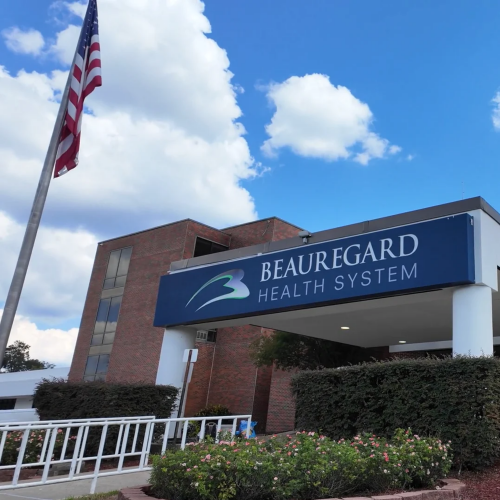
Before the Denials IQ project, getting a full picture of denials at Beauregard Health System meant pulling the pieces together by hand. Delissa Mango, revenue cycle manager, oversees work that runs from financial clearance through coding and denial prevention, so she needed to see where claims were going wrong without hunting for it.
“Before the Denials IQ project, it was a very manual process for us,” she said. “It was great to see everything put together in one spot where we could easily look at those things.”
That started to change when Beauregard and REDi Health began working together on Denials IQ.
Watch the short video below to see Beauregard’s story.
A Hospital Built by Its Community
Beauregard Health System has cared for DeRidder, Louisiana, a town of just under 10,000 people, and the surrounding area since its hospital opened in 1950. Local leaders came together back then to bring healthcare close to home. For many people in Beauregard Parish, it’s still their primary source of care.
That’s the part of the job Delissa holds onto. “I love working in rural healthcare because we’re taking care of our community,” she said. “These are our families, our friends. You know, people that we see at Walmart.”
What Is Denials IQ?
Most rural hospitals work denials one claim at a time, through the EMR work queue. Denials IQ doesn’t touch that queue at all. Instead, our team works upstream, finding patterns across hundreds or thousands of claims so the hospital can see which causes keep repeating. Denials IQ points to where the fixes belong, like a recurring registration error or a code that’s often denied. The hospital makes the changes, so the same denials stop coming back.
To build that view, our team combines a hospital’s 835 remittance data from payors with encounter data from its EMR in a Power BI dashboard made for that hospital. Each denial is sorted into a category, such as coding, billing, documentation, or eligibility. It’s then traced back to where it likely started: registration, coding, or the ordering provider.
Teams can drill down by payor, department, and denial type to see where problems cluster. We call this topographic denial analysis. Much like a topographic map shows peaks and valleys, it maps where denial activity is concentrated across the hospital. That map points the team to the upstream habits behind their denials, so the hospital knows which changes will keep claims out of the queue. Teams that want hands-on help making those changes can move into Denials Navigator. Learn more about Denials IQ.
Putting Every Denial in One Place
Getting started took some persistence: the hospital’s files were tricky to access, so our team worked through those hurdles and built a dashboard from Beauregard’s 2024 data.
Delissa was glad to see how little of that legwork landed on her staff. “They were able to gather our data. They didn’t need much help from us at all,” she said.
Some of the dashboard’s findings confirmed what the team already suspected. “We knew a lot of the things, but it was nice to see it all put together on paper,” Delissa said.
The project also turned up some extensive billing errors, plus gaps in the revenue cycle the team could fix. “We learned where we could clean up things fast,” she said.
The final review, updated with more recent files, covered 18 months of claims from January 2025 through June 2026. About 8% of those claims were denied, close to 10,000 denials in all. Denials IQ narrowed them to three priority areas accounting for 47% of denied claims: eligibility and insurance validation, ER billing documentation, and infusions.
Cutting denials in those three areas by 25% would save an estimated $202,243 a year through less rework, faster payment, and fewer accounts written off as bad debt. ER billing documentation carries the most at $100,785, followed by infusions at $69,257 and eligibility at $32,201.
Turning Denials Insights Into a Plan
The first dashboard, built from 2024 files, gave Delissa a look back. It also made her want more. “I told you guys we have to figure out how to get our data from today,” she said. “I have to see it!”
Current data was harder to reach than the 2024 files. Our team kept working on access until they found a way to pull it, then walked Delissa through the process. She has since shared those steps with other vendors who hadn’t been able to get the same data.
Her push, and the work to answer it, is why the final review runs through June 2026. The team’s priorities now rest on where things stand today, not on claims that are two years old.
Since the project, the Beauregard team has settled on the path it’ll take to correct the issues it found.
“The insights we gained from this project helped us focus our attention on where we wanted to head next,” Delissa said.
For a revenue cycle team covering everything from financial clearance to denial prevention, a clear list of where to start means their time goes to the fixes that matter first. And it all ties back to the reason Delissa does this work: “It’s nice to just take care of our hometown people and our patients here.”
You're Not Alone With Your Denials
Plenty of rural hospitals are where Beauregard was. They know denials are costing them, but the reasons are scattered across remittance files and work queues. Small revenue cycle teams spend their days working claims one at a time, with little room to step back and look for patterns.
At Beauregard, one clear view turned nearly 10,000 denials into three priorities worth an estimated $202,243 a year. For a small team, that means hours go where they’ll count. For a community hospital, it means protecting the revenue it needs to keep caring for the people it serves.
If you’re struggling to see the real reasons behind your denials, we’d like to help. Reach out to REDi Health about Denials IQ.